

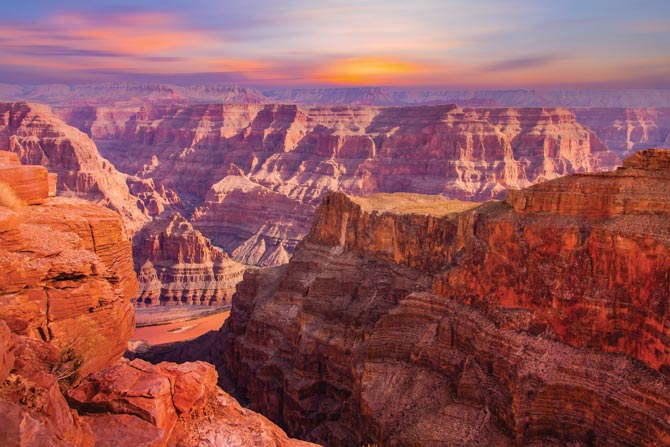
Ten men are deep in the Grand Canyon. Their expedition – to map the river corridor – marks the end of the era of exploration in the canyon.
But that night the river is trying to end them.
Unseen upstream rains cause a surprise flood. All night long, the river climbs. The men scramble in the darkness, tripping over rocks, repeatedly moving their gear and boats to higher ground.
The river doesn’t stop. It rises 14 feet in one night. After daybreak, it rises another 7 feet. Unbeknownst to the men, the outside world thinks they are dead.
The water flow rate has risen from 10,000 cubic feet per second to 125,000 cubic feet per second. In 2021, with Glen Canyon Dam controlling the river, typical flows are around 13,000 to 17,000 cubic feet per second. A 30,000 cubic feet per second flow is sporty. You’d better know what you’re doing on the water.
But to witness a flow of 125,000 cubic feet per second is to stare into the face of God.
The party waits three days, miserably crouched amongst boulders high up on a slope, before water levels drop to the point where their survey point is exposed again and they can continue work. When they arrive at Diamond Creek, long overdue, someone brandishes a newspaper. “HOPE NOT GIVEN UP FOR RIVER PARTY!” the headline thunders.
The nation hadn’t forgotten them. And, almost a century later, their work is still remembered.
Arizona State University Library’s Map and Geospatial Hub has just unveiled a dynamic multimedia exhibit describing, explaining and celebrating a historic collection of maps and charts of multiple Colorado River surveys conducted by the U.S. Geological Survey between 1902 and 1923.
“Visualizing the Survey” visually dissects and simplifies the mechanics of these technical and beautiful survey sheets, while putting their historical and geographical significance in perspective.
Matthew Toro, a research geographer and director of Maps, Imagery, and Geospatial Services at the ASU Library, explained the impetus behind the project. “I started thinking about the role of maps in making us sort of internalize and come to terms with the scale and the grandeur of the Grand Canyon,” Toro said. “I started asking questions about how this thing was mapped. It started with the government saying, we need to map the Colorado River for strategic purposes, for scientific purposes, et cetera.”
John Wesley Powell, the one-armed Civil War vet who first traveled through the canyon on the river, did some mapping on his second expedition, but nothing significant. Clarence Dutton’s 1882 atlas of the canyon treated the entire area, but not the river corridor.
The Birdseye expedition in 1923 was the last of the government surveys. It’s legendary among river runners to this day.
“The 1923 trip is an amazing feat,” said Tom Martin, founder of River Runners for Wilderness and the Grand Canyon Private Boaters Association. Martin is also the author of river and hiking guides and a volunteer for the Grand Canyon Hikers and Backpackers Association and the Grand Canyon Historical Society. He is widely acknowledged as the leading expert on canyon river history.
“They ran a level line survey in oar boats for 260-some miles and closed within four feet (of the starting survey from downriver). There’s some very cool history there, including a flood from the Little Colorado River that came down on them as they were working their boats around Lava Falls. These maps, including the Glen Canyon, Cataract Canyon, Green, upper Colorado, and San Juan surveys were all completed in the early 1920s and ended the era of exploration. They were used extensively by later river runners. The oldest river guide I have found is from 1950. It uses these maps.”
The intent was to explore possibilities for power generation, identifying potential dam sites. Claude Birdseye, the chief topographic engineer of the USGS, led the expedition.
These weren’t zip-from-camp to-camp trips. The men had to maintain a line of sight from one survey point to the next, so they had to land – and hold their positions – every few hundred yards, even in rapids or where the canyon walls were almost vertical.
They floated for two months and 19 days, from Lees Ferry to Needles, California. In all they selected 29 potential dam sites.
The visualization shows the historical surveys in relation to things like modem river mile markers. “We’ve actually overlaid them with historic aerial photography before the Glen Canyon Dam created Lake Powell,” he said. The Birdseye maps were ultimately used in the creation of two dams and a number of water diversion projects.
Researchers today continue to use the maps, photographs and survey points – almost 100 years after they were collected.
“They’re really significant,” said Bob Davis, chief of cartographic data services for the National Geospatial Program of the United States Geological Survey. “They provided quite a foundation to what became the topographic map division.”
The original maps are in the library collection, bound in volumes. They’re accessible to anyone who would like to see them, but putting the collection online opens it up
to anyone in the world with an internet connection.
Visualizing the last great Grand Canyon expedition – ASU News
This story originally ran in Backsights, Published by the Surveyors Historical Society Spring 2021, Volume 40 Number 1.
See the accompanying article – Editor’s Pen: The Lost Canoe.